Are you sure? Did you try it?
7 min read manual , testing , javascript , qa , code-coverage
There’s a question that echoes through every legacy codebase, every late-night deploy, every “it works on my machine” moment: did you actually try it? Not in a dismissive way - in the most honest, pragmatic sense. Did someone, with their own hands, open a browser and verify that the thing works the way it’s supposed to?
This article is about that question, where it comes from, and a small tool I built to try to answer it in a more structured way.
A life before QA
For several years I worked as a web developer. Not in a greenfield startup with a pristine test suite and a CI pipeline with 90% coverage - but in the kind of real-world context that most developers know well: a large, tangled codebase that grew organically over time, with layers of frameworks, undocumented business logic, and a // TODO: refactor this comment that had been there since 2014.
In that world, writing a feature or fixing a bug meant navigating code that nobody fully understood anymore. And testing? There were no unit tests to run, no automated E2E suite to trigger. The only real verification available was manual: you deployed to staging, you opened the browser, you clicked around, and you checked whether the user would see what they were supposed to see - or, in the case of a fix, not see the problem anymore.
It’s a very different mental model from TDD. There’s no red-green-refactor cycle, no coverage report congratulating you on reaching 80%. There’s just: did you verify that the end user sees the feature as expected?

That question became a kind of professional instinct. And when I later moved into the QA world, I realized it had shaped how I think about quality more broadly. Automated tests are invaluable, but they describe a model of the system - and that model is only as good as the assumptions baked into it. Manual exploration is how you challenge those assumptions with reality.
The gap between “tested” and “tried”
Here’s the thing about legacy code: it doesn’t lend itself to the clean abstractions that make automated testing easy. Functions have side effects, components are tightly coupled, global state leaks everywhere. Writing a meaningful unit test for a piece of legacy JavaScript can take longer than writing the feature itself - and the test often ends up just mirroring the implementation rather than describing the intended behavior.
So teams settle into a rhythm: code gets written, reviewed, and deployed, and somewhere along the way someone - usually the developer themselves - clicks through the affected area of the app and checks that it looks right. This is real, useful work. But it’s invisible. There’s no artifact, no trace, no way for a reviewer or a future teammate to know that it happened. The PR gets merged and the institutional knowledge that yes, someone actually tried this disappears.
This is the gap I kept thinking about.
The idea behind manual-code-coverage
What if we could make manual testing leave a trace? Not in a heavy, process-overhead way - but in a lightweight, developer-native way that integrates with the existing PR workflow?
That’s the core idea behind manual-code-coverage: a self-hosted tool that instruments your JavaScript frontend at build time, collects the coverage data generated by a real human navigating the app, persists it to a server, and then lets you verify - on a per-PR basis - that the code changed in that PR has actually been executed by someone.
The architecture is straightforward. A Vite plugin instruments the build using babel-plugin-istanbul (the same instrumentation used by most JavaScript test runners). A browser client reads window.__coverage__ - Istanbul’s runtime coverage object - and flushes deltas to a Fastify server at regular intervals. The server stores coverage keyed by commit SHA. A CLI tool, mcc, can then generate an HTML report or verify a PR by checking how much of the diff was covered by recorded sessions.
MCC_COVERAGE=true \
MCC_COMMIT=$(git rev-parse HEAD) \
MCC_TESTER=alice \
MCC_ENDPOINT=https://your-mcc-server.railway.app \
vite build
The output is something you can drop into a CI pipeline: a GitHub Actions step that posts a comment on the PR showing exactly how many of the modified lines were actually executed during manual testing - by whom, and when.
Seeing it in practice: two PRs
The repository includes two example PRs that show the tool in action on a Vite + React demo app.
PR #1 - the happy path
The first PR adds a clamp(value, min, max) utility to a counter demo and exposes it as a button in the UI. It’s a simple case: two branches, easy to cover manually by clicking the button a couple of times. The PR comment shows exactly what you’d hope to see:
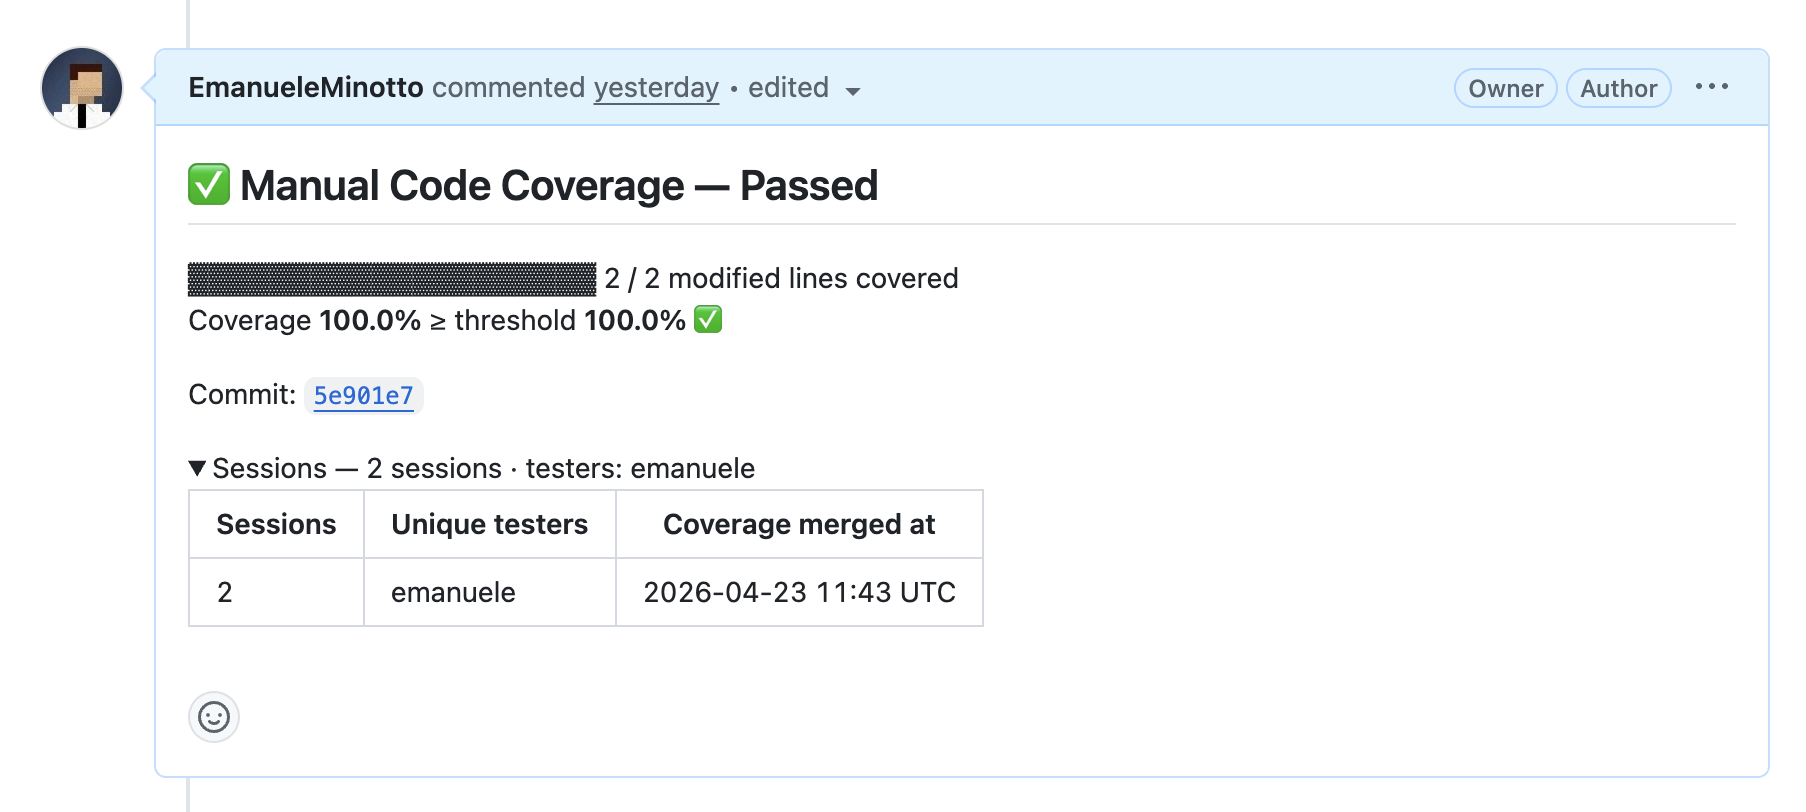
Clean, verifiable, and attached to the PR. Anyone reviewing this PR can see, without asking, that the feature was manually tested.
PR #2 - the non-happy path
The second PR is far more interesting. It adds a registration form with a validator.ts module containing six validation functions and roughly 42 branches - validating email format, password strength, username constraints, and cross-field rules like confirmPassword depending on password.
The PR comment tells a very different story:
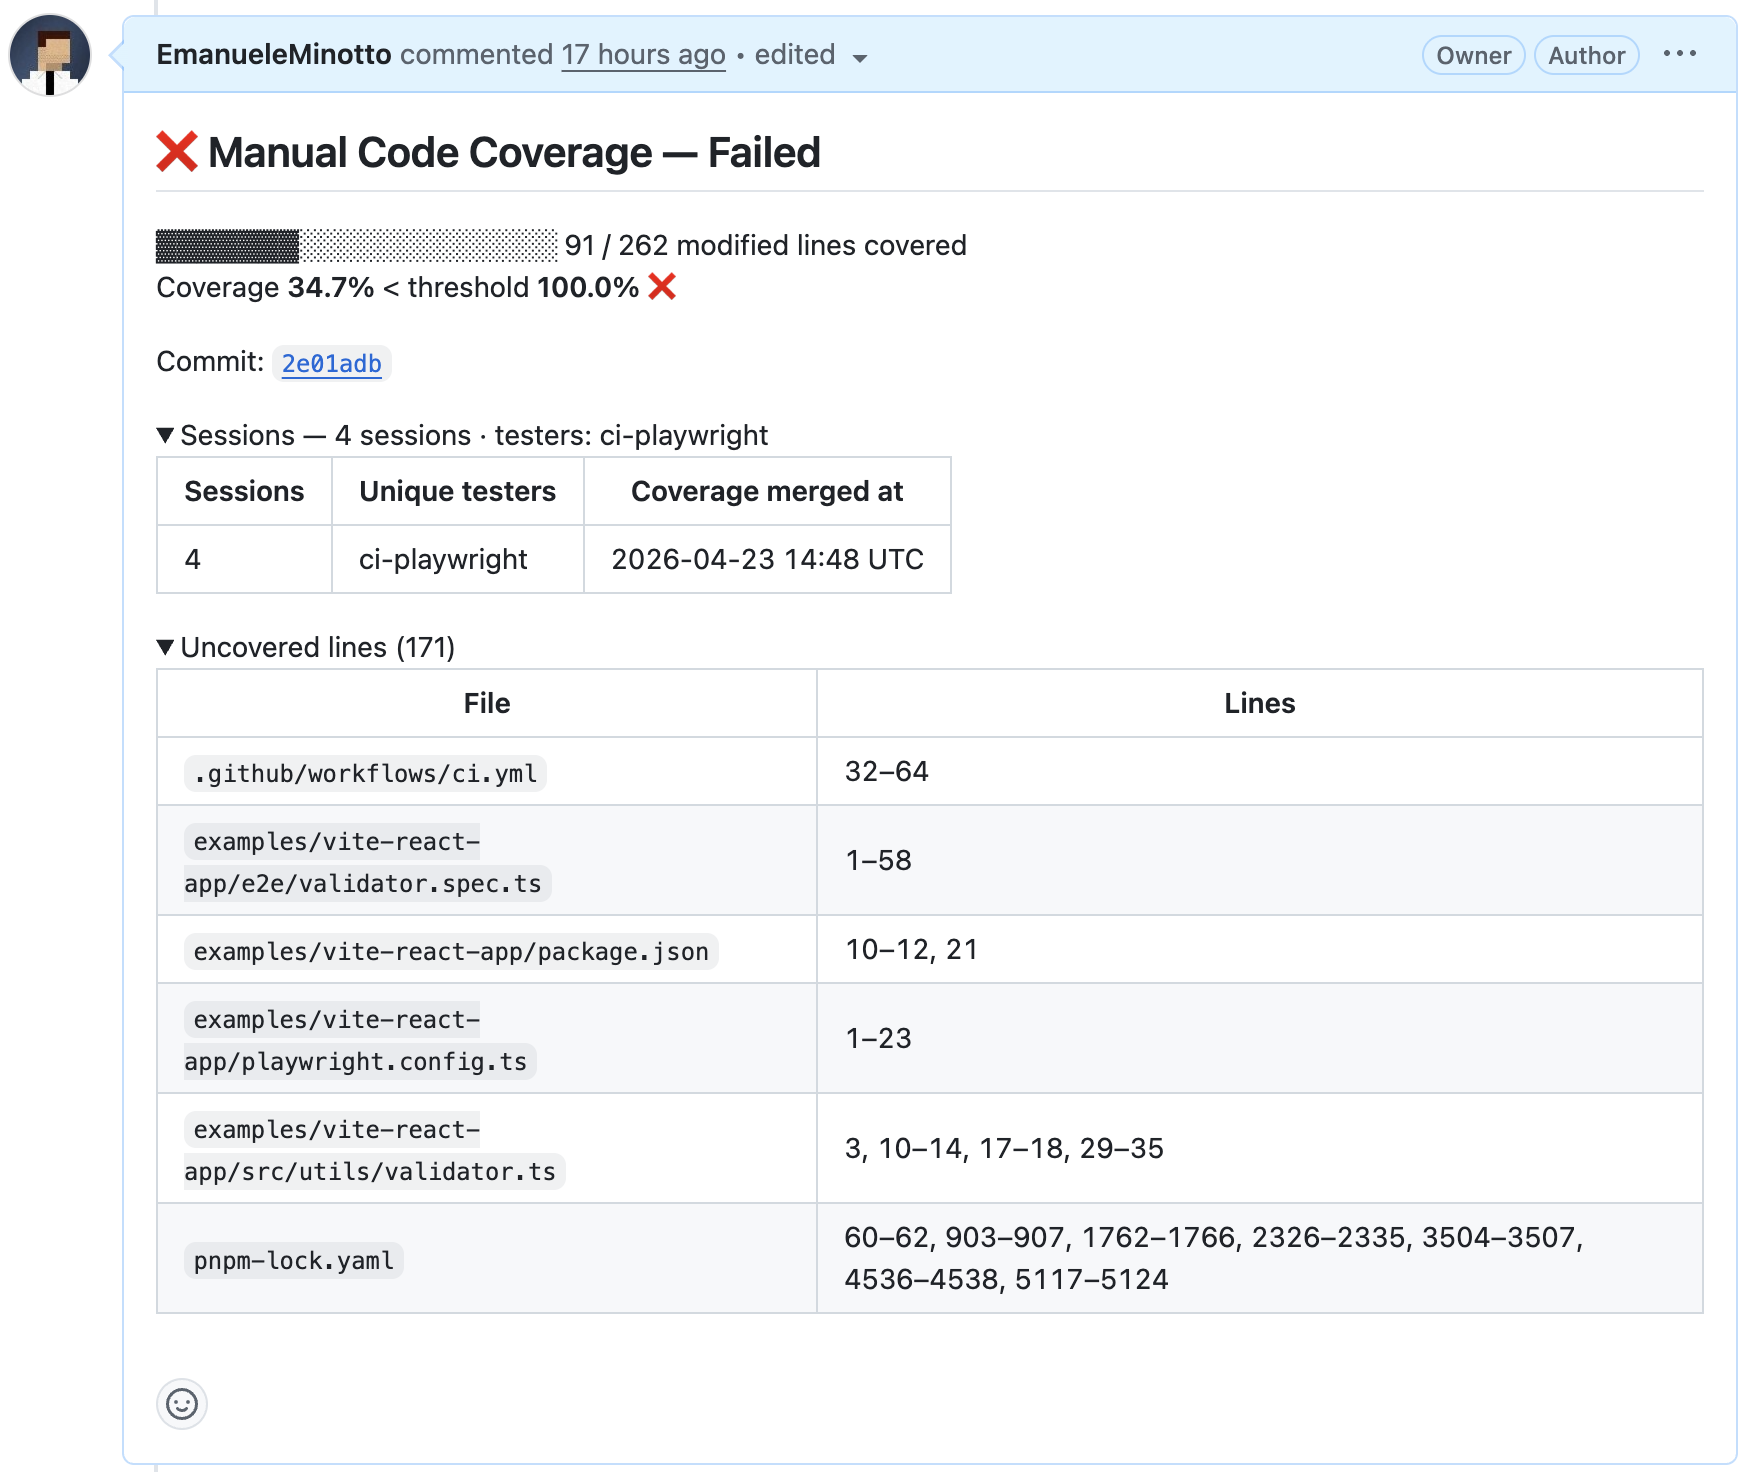
And this is where it gets genuinely interesting: the 34.7% wasn’t from lazy manual testing - it was from Playwright. Four automated E2E tests were written to cover the most common paths through the form. But covering all the validation branches requires deliberately triggering the error states: an email without @, a password without an uppercase letter, a username with special characters. A user navigating the app normally would never do those things. The automated tests caught roughly 40% of the branches; the rest require intentional exploration.
This is the insight the tool tries to surface. It’s not about shaming developers for incomplete coverage - it’s about making the actual state of testing visible, so that gaps can be consciously acknowledged rather than accidentally overlooked.
This is a proof of concept - and that’s fine
I want to be transparent about where this project stands. manual-code-coverage is currently much closer to a proof of concept than a production-ready tool. A few things are worth calling out explicitly.
Coverage semantics are simplified. Istanbul tracks whether each branch of code was executed, but the current implementation only reports whether a line was touched at least once. This means a function with an if/else will show as “covered” even if only one branch was ever executed. It’s a meaningful signal, but not a complete one.
Configuration is still sparse. One obvious example: pnpm-lock.yaml and other lockfiles show up in the uncovered lines report, even though they don’t represent executable code and should clearly be excluded. The tool needs a proper exclude configuration to handle this gracefully.
Only client-side JavaScript is tracked. Backend code - Node.js servers, API handlers, database logic - is entirely outside the scope of the current implementation. The instrumentation happens at Vite build time, so only what runs in the browser is captured.
Playwright makes manual testing sustainable. The second PR demonstrated something almost paradoxical: using an automated test runner to simulate manual testing for coverage purposes. Playwright’s sendBeacon integration means that every test run flushes coverage to the server just like a human session would. This is genuinely useful - imagine having to re-run 15+ manual scenarios every time a branch changes. That would be a nightmare. Playwright handles the repetitive happy (and not-so-happy) paths automatically; a human tester can focus on the exploratory, edge-case work that’s actually hard to automate.
Why this matters
The framing I keep coming back to is this: in the TDD world, tests are first-class citizens. They live in the repository, they run in CI, and their results are visible and reproducible. Manual testing, by contrast, is often treated as a necessary but ephemeral activity - something that happens, but leaves no trace.
For greenfield projects with good test culture, this is fine. But for the enormous amount of software that runs on legacy codebases, on teams without dedicated QA, or in contexts where the cost of writing automated tests is genuinely prohibitive - manual testing is not a fallback. It’s the practice. And it deserves better tooling.
manual-code-coverage is an early attempt to give that practice the same kind of visibility that automated tests have always enjoyed. It’s rough around the edges, incomplete in scope, and very much a work in progress. But the question it’s trying to answer is the right one.
Are you sure? Did you try it?
Now we can prove it!